High-yield bonds are sending the stock market a warning sign. This is not a prediction, but a leading indicator. Just because it's happened in the past, doesn't mean it will happen in the future.
Yes, the S&P 500 made a new all-time highs on Wednesday and Friday. Yes, the Fed’s easy money policy is helping to boost stock prices. Yes, President Trump wants a higher stock market. And yes, we are entering a seasonally bullish period for stocks.
And, if high-yield bonds were making new highs along with stocks this week, then I’d have to wipe the bearish egg off my face and concede that the stock market isn’t in as much trouble as I thought.
The action in high-yield bonds tends to precede the action in the stock market by anywhere from two days to two weeks. So, it’s notable that while the S&P was posting a new all-time high on Wednesday, junk bonds were falling (see down arrow on chart below).
And, by the look of the following chart of the iShares iBoxx High Yield Corporate Bond ETF (HYG), junk bonds look vulnerable to a much more serious decline.

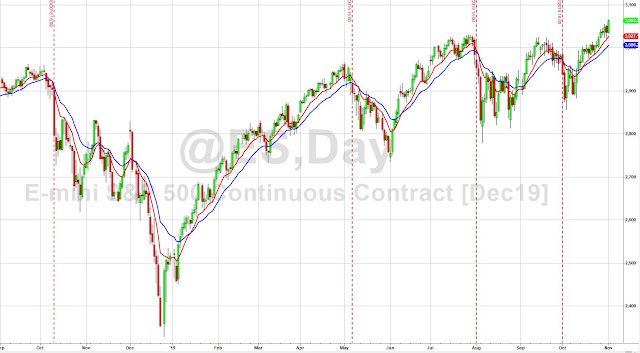
The red vertical lines indicate beginnings of reversal in the price of HYG. They preceded by days/weeks a reversal in the S&P 500, shown in this daily chart of the S&P 500 index futures (which tracks the S&P 500).
Yes, the S&P 500 made a new all-time highs on Wednesday and Friday. Yes, the Fed’s easy money policy is helping to boost stock prices. Yes, President Trump wants a higher stock market. And yes, we are entering a seasonally bullish period for stocks.
And, if high-yield bonds were making new highs along with stocks this week, then I’d have to wipe the bearish egg off my face and concede that the stock market isn’t in as much trouble as I thought.
The action in high-yield bonds tends to precede the action in the stock market by anywhere from two days to two weeks. So, it’s notable that while the S&P was posting a new all-time high on Wednesday, junk bonds were falling (see down arrow on chart below).
And, by the look of the following chart of the iShares iBoxx High Yield Corporate Bond ETF (HYG), junk bonds look vulnerable to a much more serious decline.

The red vertical lines indicate beginnings of reversal in the price of HYG. They preceded by days/weeks a reversal in the S&P 500, shown in this daily chart of the S&P 500 index futures (which tracks the S&P 500).
While past performance never guarantees future events, it behooves us to pay attention. So this isn't the time to buy the market. If you're currently invested, consider holding. But put in some stop orders to protect yourself. If you're not invested, just be patient.
While I can't offer specific investing advice, because I don't know your situation, or investing plan (you do have one, right?), for my own portfolio, I'm 50% in equities and 50% in money markets. I'll take my own advice and just hold right now. See how things play out in the next few weeks.

Comments
Post a Comment
Thanks for the comment. Will get back to you as soon as convenient, if necessary.